
Research Index · 2026 Edition · United States, Australia, Brazil and Taiwan
Mubboo Flight Route Structure Index 2026: The Gap Between Airline Counts and Independent Choice
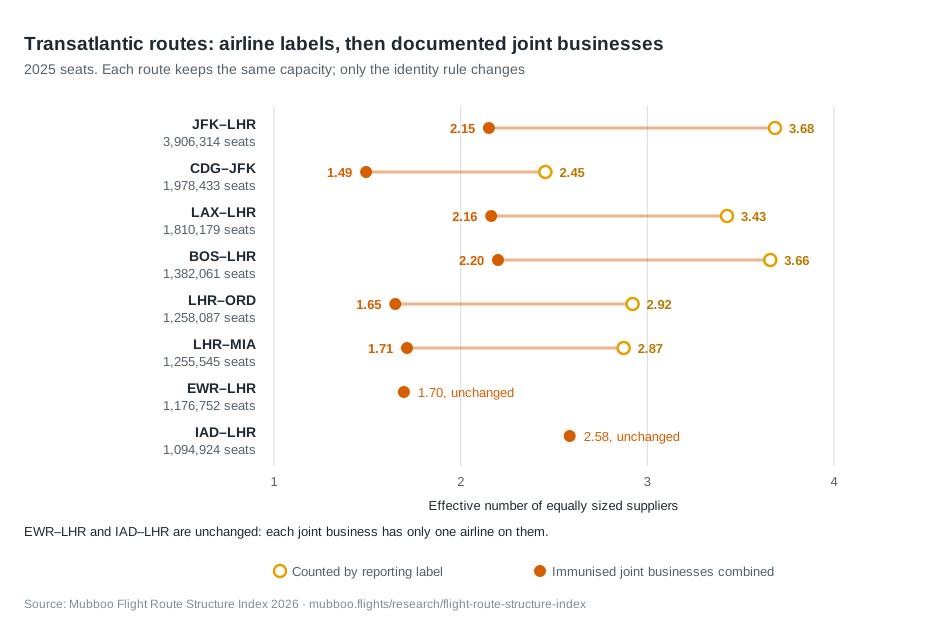
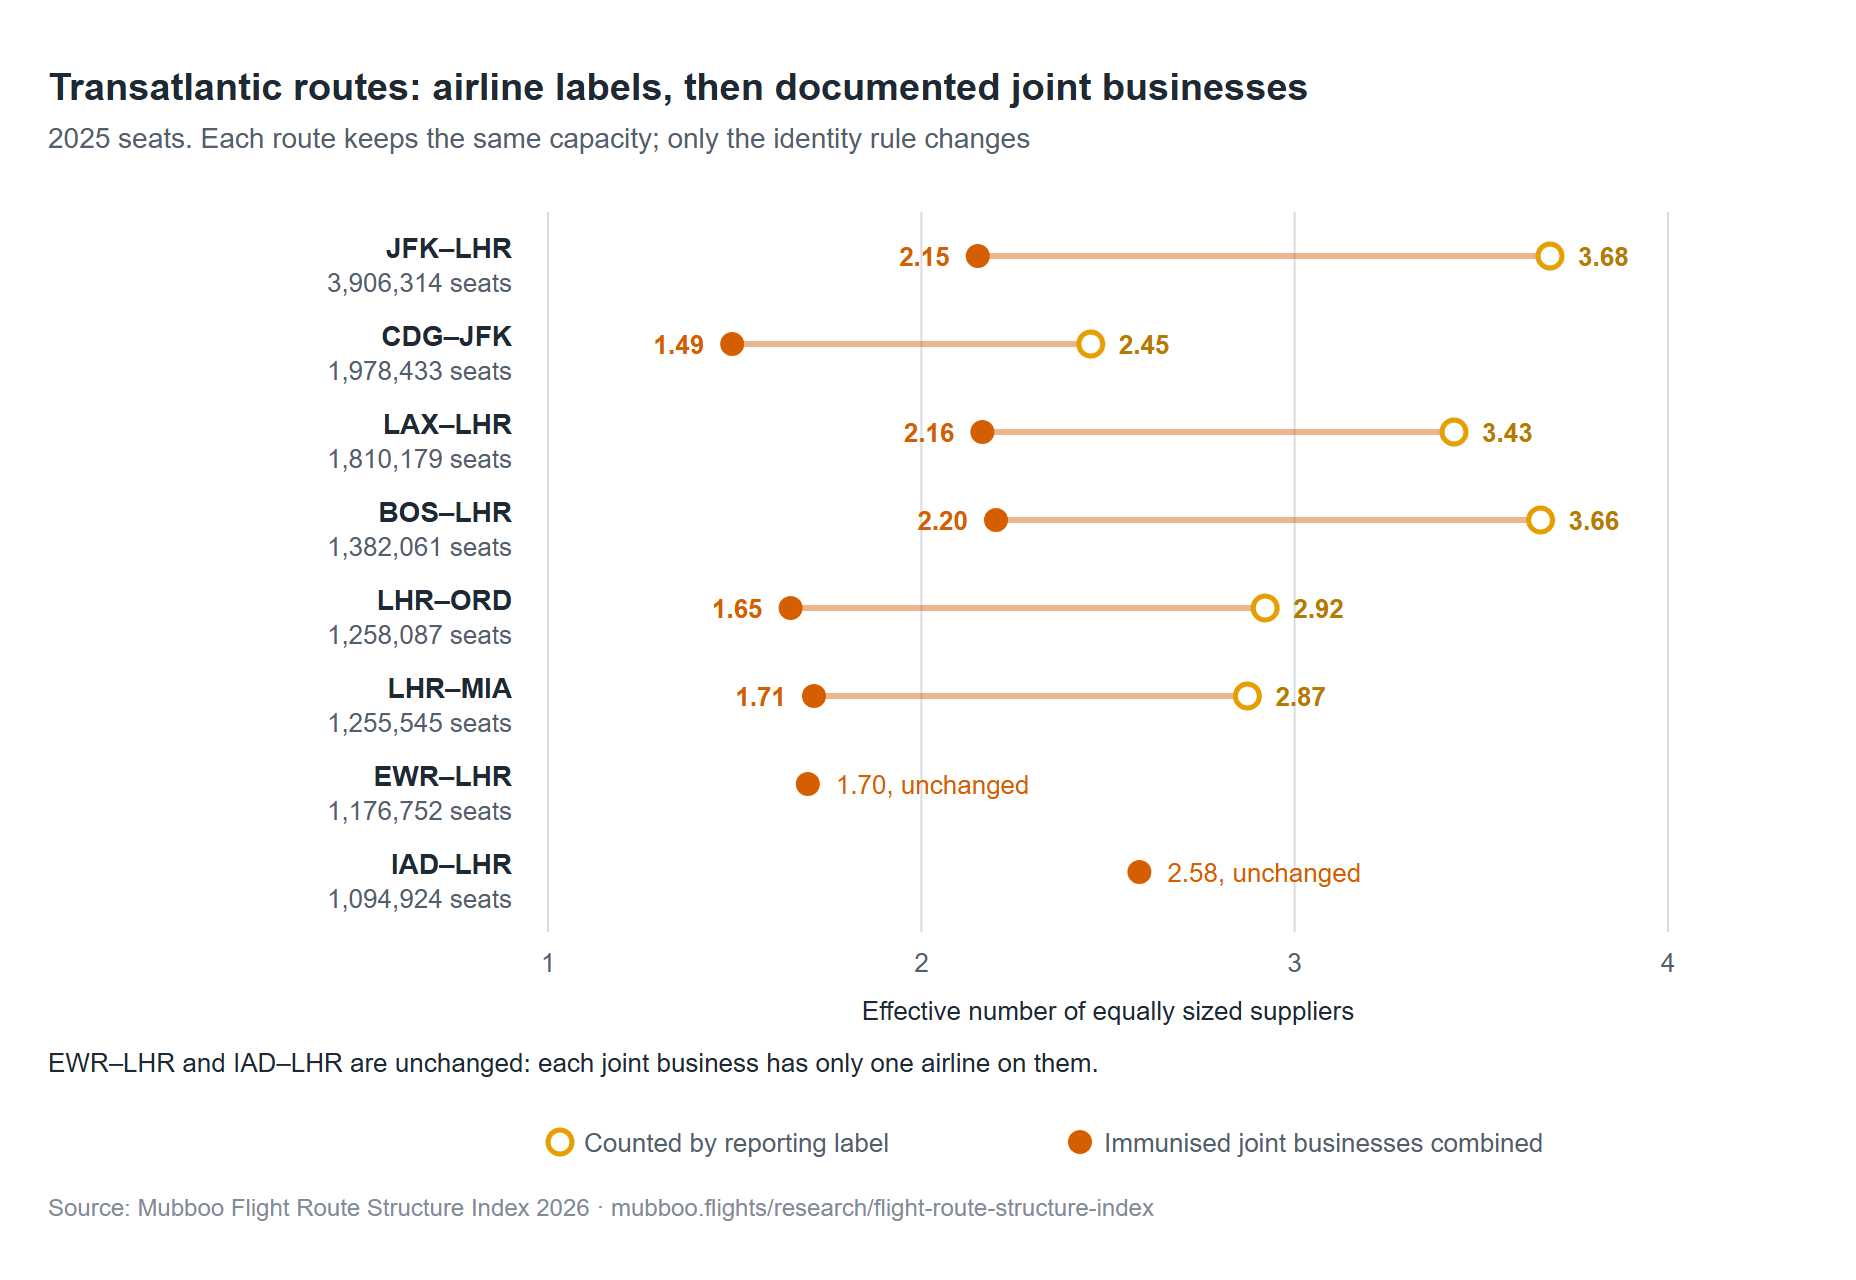
Route growth is announced as one number. It is at least three. On New York JFK–London Heathrow, five airlines supplied virtually all of the 2025 seats and the route reads as 3.68 equally sized suppliers. Combine the two transatlantic joint businesses that hold US antitrust immunity and the same seats read as 2.15. [S17] [S18]
This edition reports three things separately. Supply: how many seats arrived. Control: who held them once documented groups and authorised joint businesses are combined. Continuity: whether a second meaningful option was there in every month rather than only in the annual summary. [S01] [S02] [S12] [S17]
Two shortcuts fail. Capacity can spread more evenly without any new airline name: Perth–Singapore did exactly that. And growth inside an alliance still adds seats: Brisbane–Doha gained 134,231 under an alliance the ACCC said would likely place downward pressure on prices. This measures capacity, not fares, and covers four markets, not the world. [S01] [S09]
- New York JFK–London Heathrow: five airlines, but two immunised joint businesses hold 94.88% of the seats and JetBlue is the only independent above 5%.
- 447 US-linked routes carrying 88.0 million seats in 2025 fall inside a transatlantic joint business with US antitrust immunity.
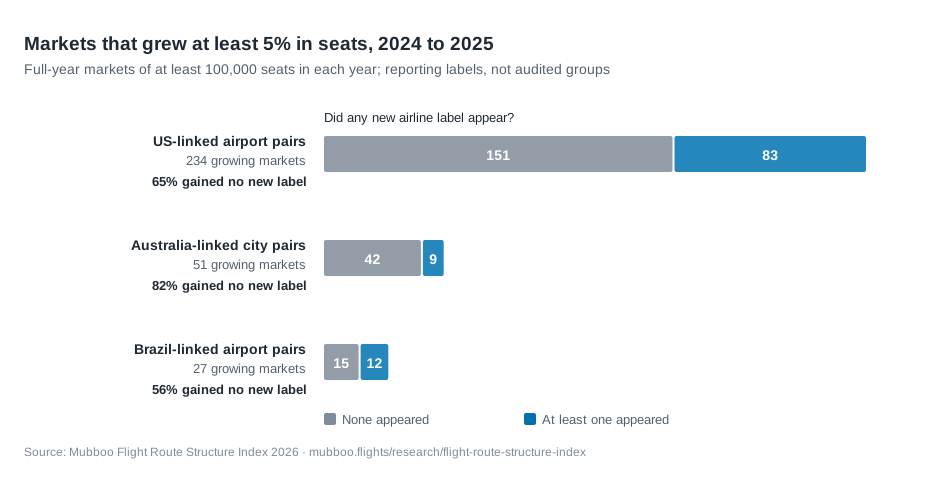
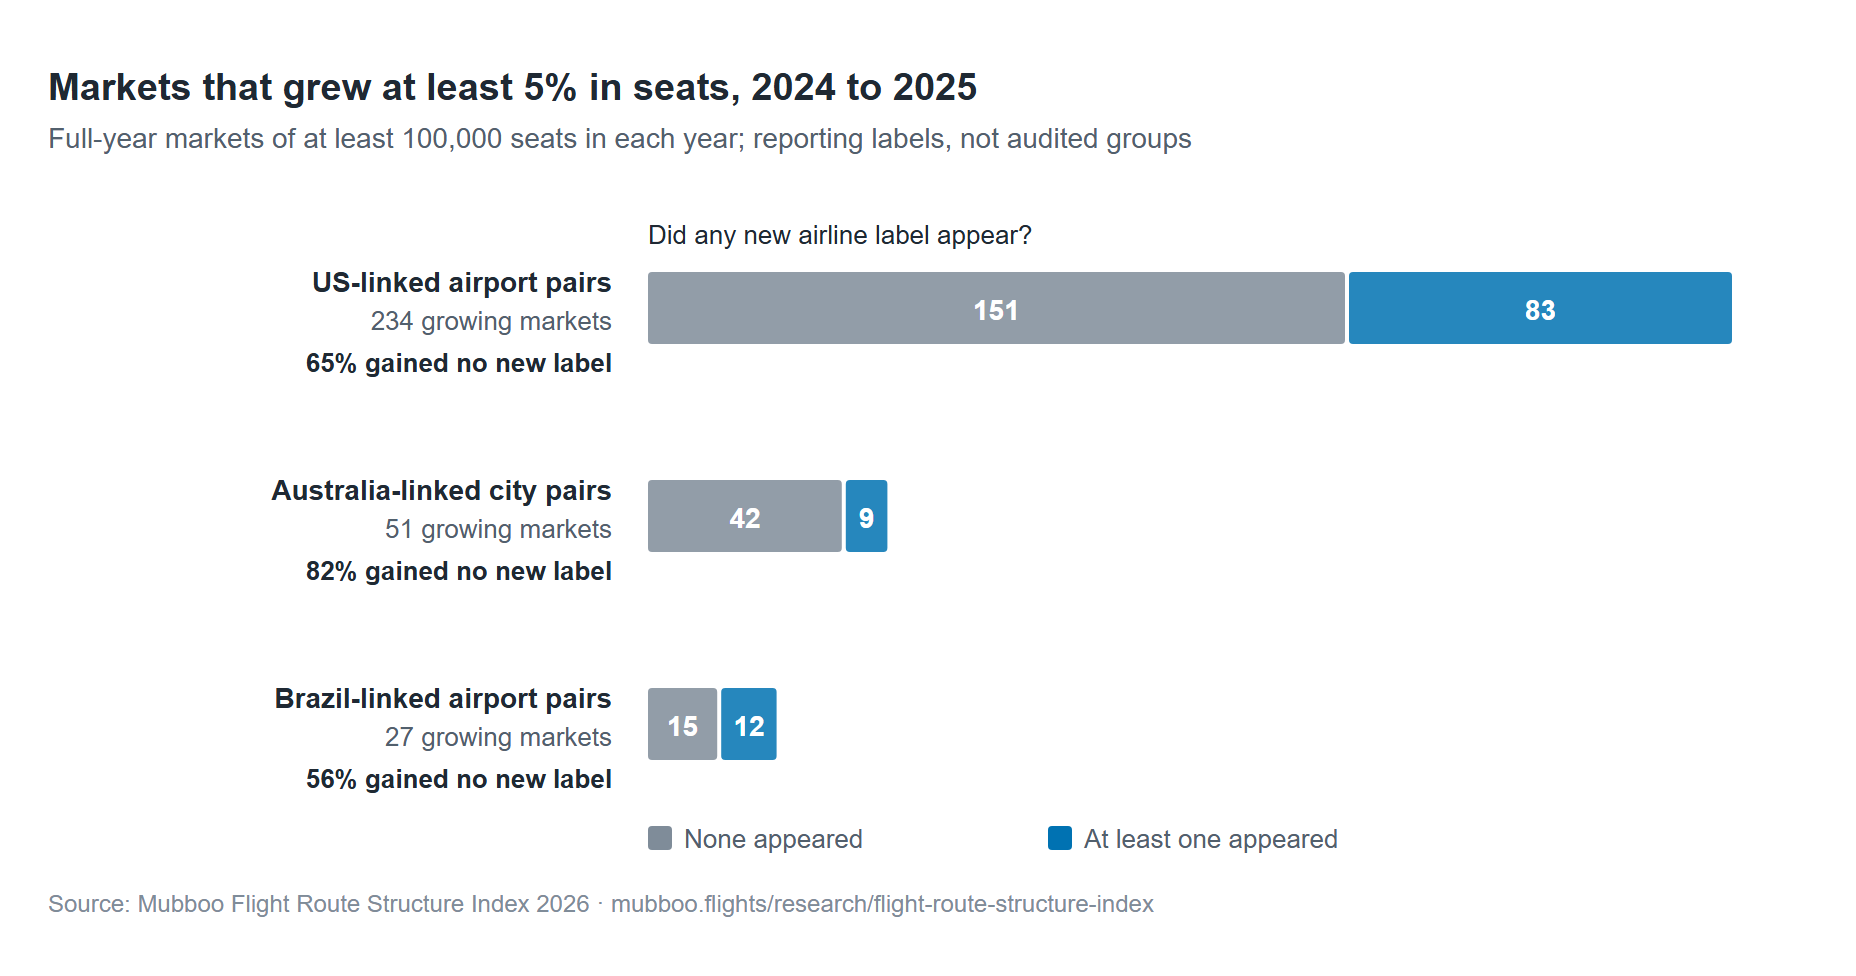
- 151 of 234 growing US routes, 42 of 51 in Australia and 15 of 27 in Brazil added no new airline label at all.
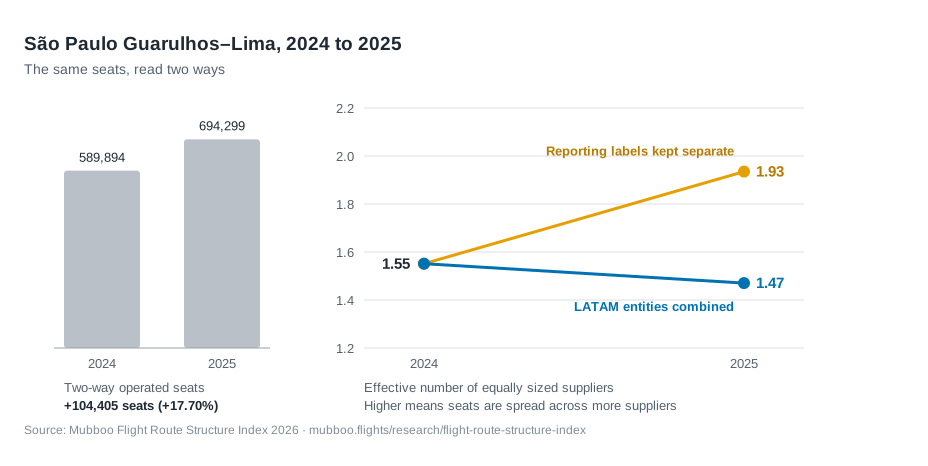
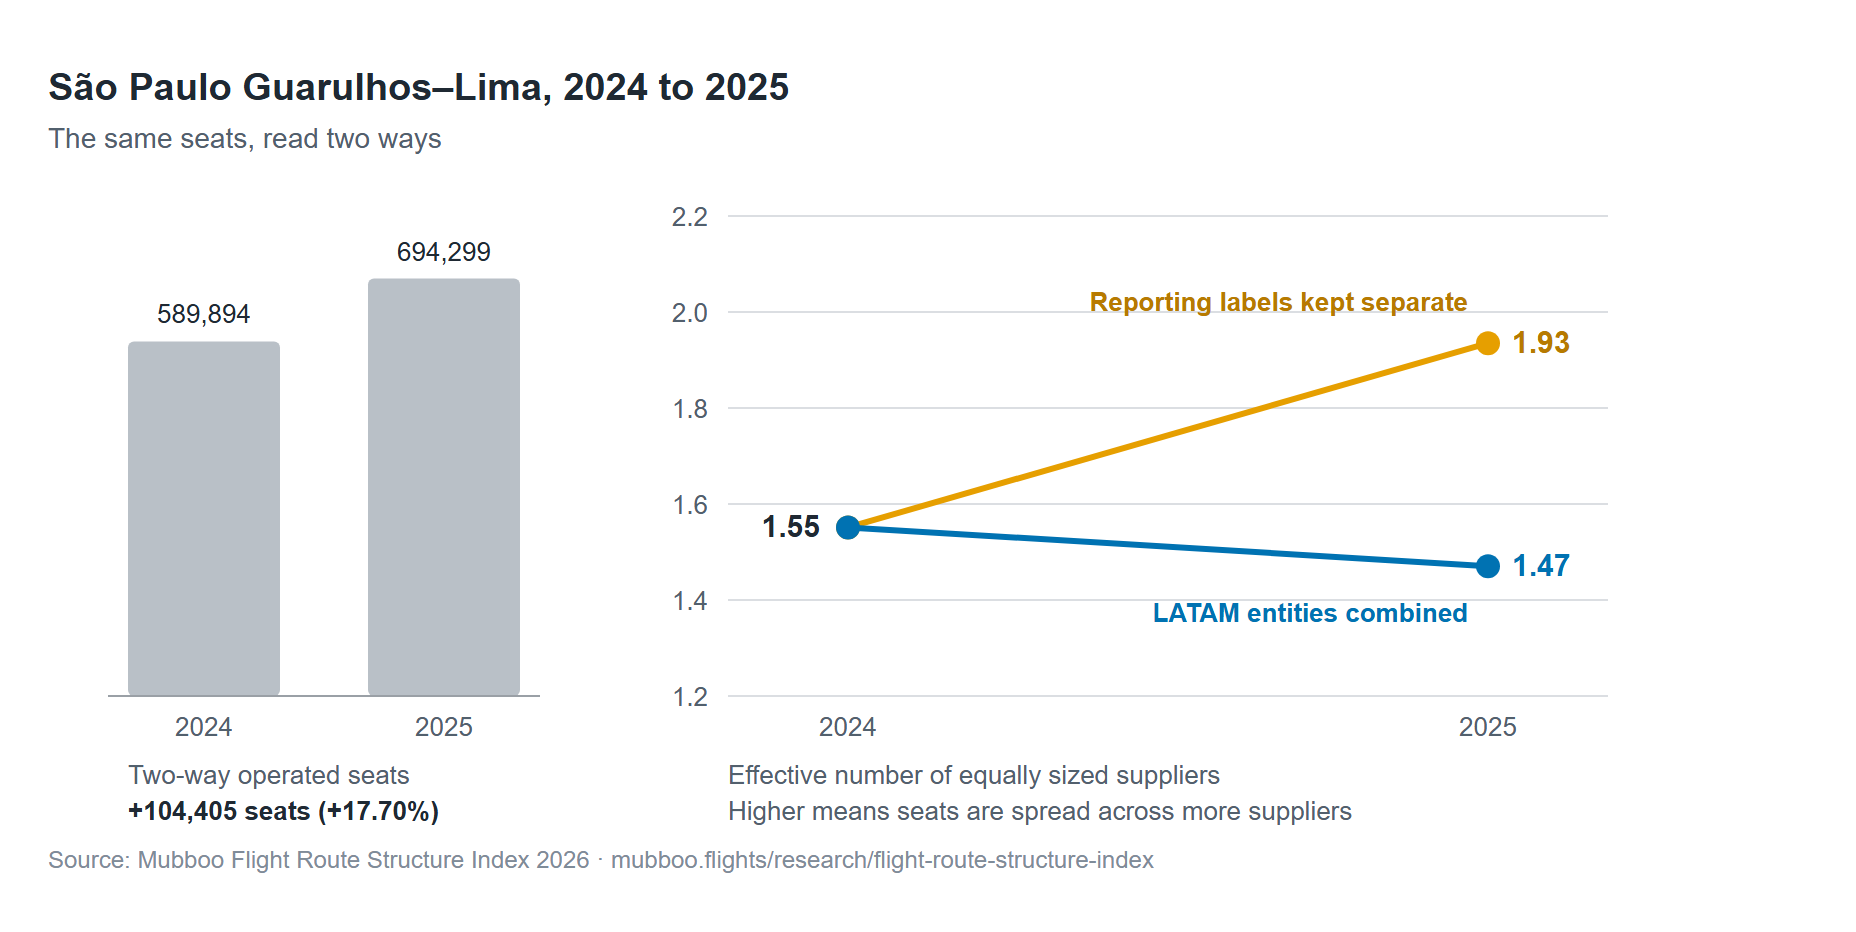
- São Paulo–Lima: seats up 17.70% and codes up from two to four, but combining LATAM's own entities takes effective suppliers from 1.55 to 1.47.
- 170 of 427 US routes with a second airline across the year did not have one in every month. In Taiwan it was 8 of 77.
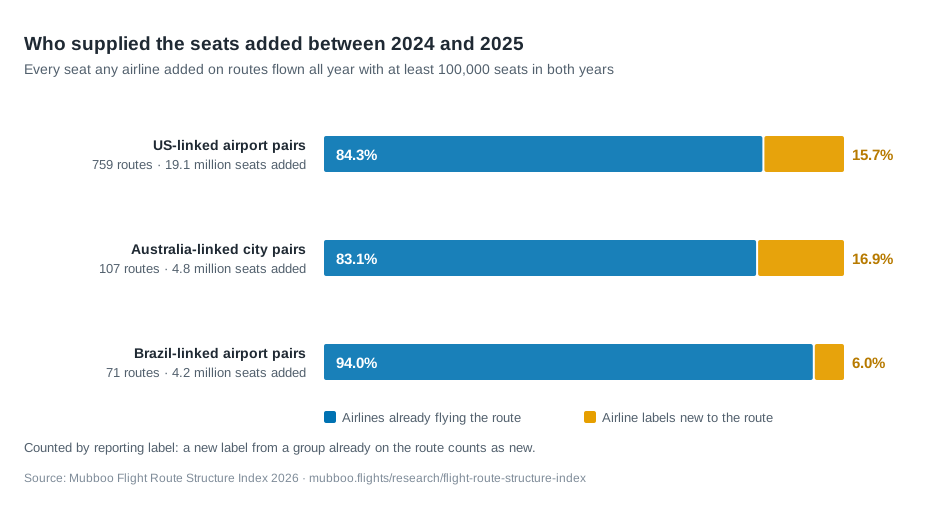
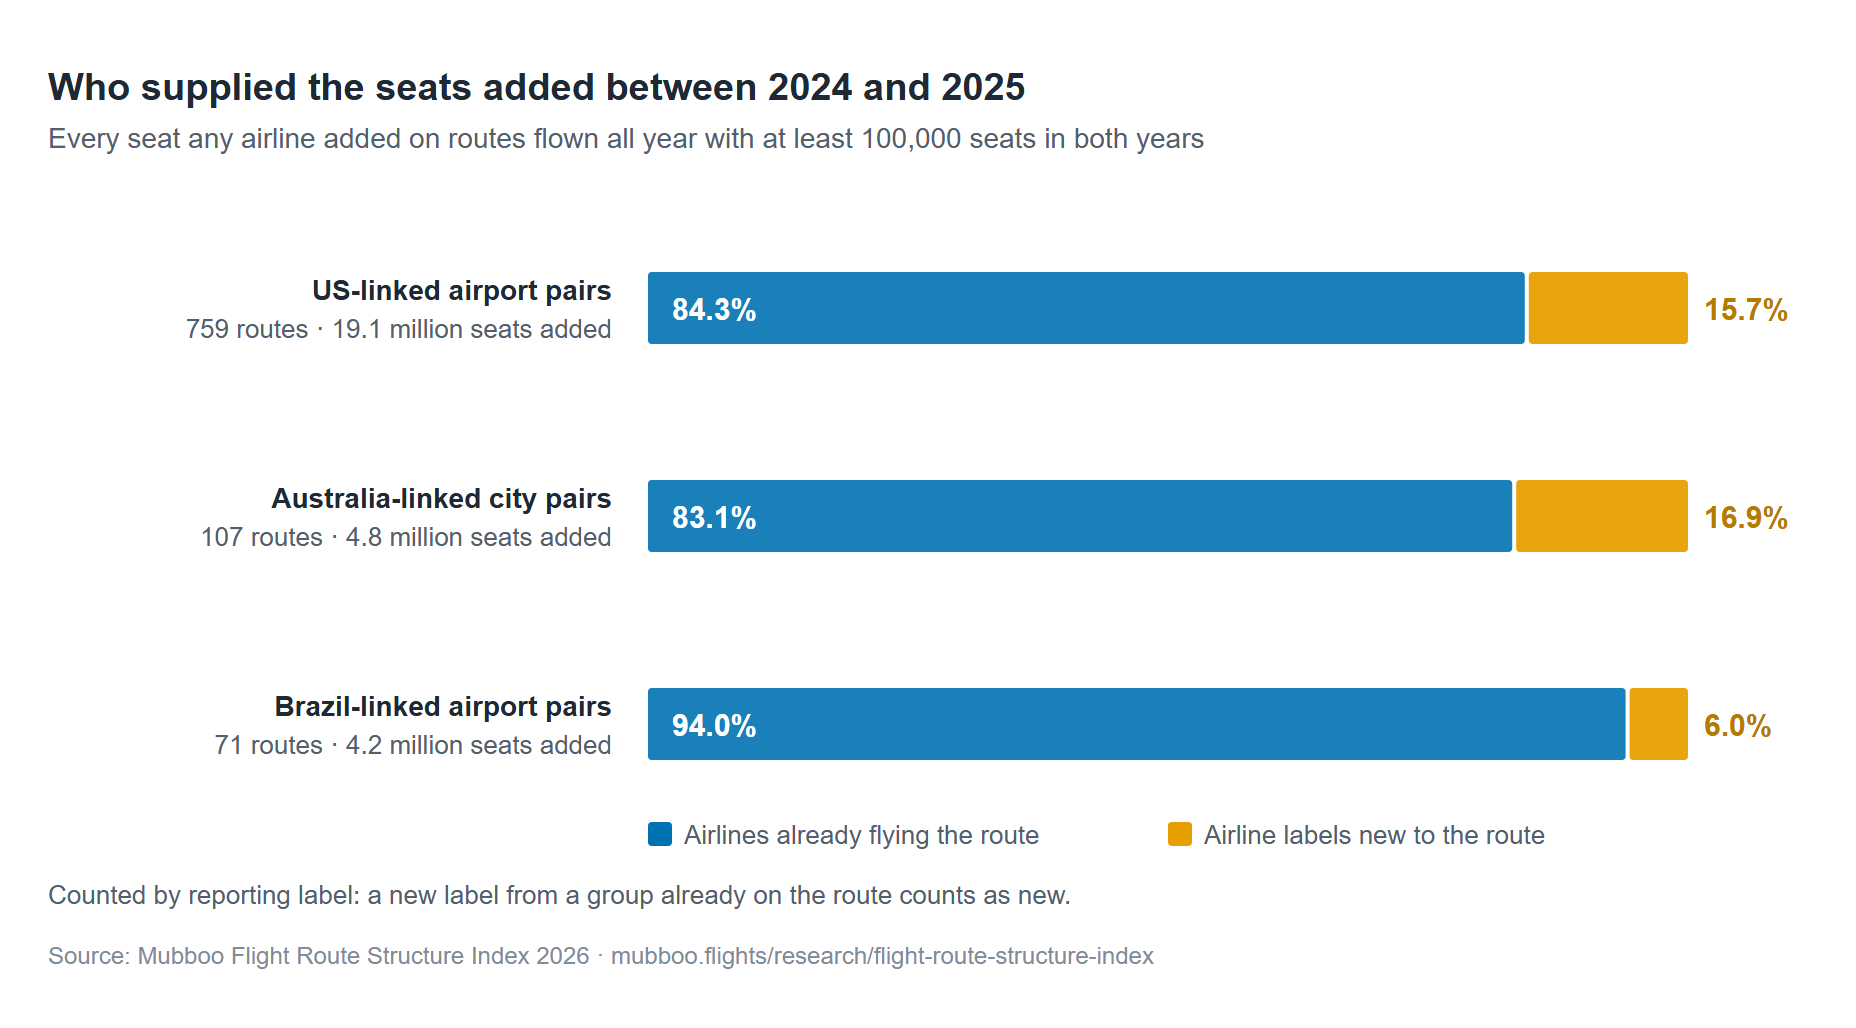
- Airlines already on the route supplied 84% of the seats added on US-linked routes, 83% in Australia and 94% in Brazil.

Video summary
Mubboo Flight Route Structure Index 2026, explained in 95 seconds
A short animated summary of this report: why the five airlines on New York JFK–London Heathrow read as about two independent suppliers once regulator-approved joint businesses are combined, how a new airline name can fly another airline’s aircraft, why a yearly total can hide the months with no second airline, and where most added seats came from. Seats and route structure only, not fares.

Read the video transcript
New York to London. Five airlines carry virtually all of its seats. Combine the two joint businesses regulators approved, and it reads like about two. Airline names and independent choices are not the same number. Here are three ways the count can fool you. One: a name isn't always a separate decision. On JFK to Heathrow, two airline pairs run joint businesses with US antitrust immunity, and hold 95% of the seats. By name, it reads as 3.68 equal-sized airlines. Combine the pairs: 2.15. It isn't just one route. Boston, Los Angeles, Chicago: the same drop. Two: a new name isn't always a new airline. Brisbane to Doha grew 52%, and Virgin Australia joined. But those flights use Qatar Airways' aircraft and crew. From July, the two report almost identical seats: 21,948 each. Three: the year can hide your month. Of 427 US routes with a second airline across the year, 170 didn't have one in every month. And growth? Most new seats came from airlines already flying the route: 84% in the US, 83% in Australia, 94% in Brazil. So next time you hear "new route" or "more airlines", ask: more seats, a reshuffle, or a truly new choice? Then check your month. The full index is free, from Mubboo Flights Research.
Mubboo Research · No. 1 · 2026 Edition
Data and citation
By Mubboo Flights Research Team · Research lead: Richard Lee
Richard Lee is the founder of Mubboo and leads Mubboo Flights Research. He sets each report's research question and method, approves the frozen results before publication, and answers methodology questions from journalists in writing at support@mubboo.flights.
- Route-level scores, 3,656 routes (CSV) Every route the 2024-2025 calculation produced, with the columns described in the data dictionary. Licence: CC BY 4.0.
- Data dictionary (Markdown) What each column means, and what the rows are not.
- Media kit (ZIP) Every figure, the citations, a one-page summary and the data files in one download.
- Archived copy on Zenodo: doi:10.5281/zenodo.22995092 A permanent, versioned deposit of the data files for citation.
How to cite: Mubboo Flights Research (2026). Mubboo Flight Route Structure Index 2026: The Gap Between Airline Counts and Independent Choice. https://mubboo.flights/research/flight-route-structure-index Data: https://doi.org/10.5281/zenodo.22995092
Journalists and researchers are welcome to cite these findings, with attribution to Mubboo Flights Research and a link to this report.
Method, sources and limits are set out below. More from Mubboo Research.
Does more airline capacity mean more competition?
Not on its own. Seats measure supply. How those seats divide among suppliers is a second question, and whether the division holds up month after month is a third. The six routes in this edition were chosen because each answers those questions differently, and two of them answer in opposite directions. [S01] [S02]
The reverse shortcut fails too. A route with no new airline name can still become more evenly split, and a route whose score never moves can still have gained capacity travellers use. Both of those appear in the Australian records. [S01]
What the score measures, and what 50 means
For each month, take every reporting label's share of that month's seats, square the shares, add them up. That is the Herfindahl-Hirschman Index, used here as a fraction between 0 and 1 rather than on the familiar 0-10,000 scale. Average the twelve months, subtract from one, multiply by 100. [S16]
One supplier in every month scores 0. Two evenly matched suppliers in every month score 50, four score 75, and a real market never reaches 100. Beside the score we publish one divided by mean monthly concentration, which reads as an effective number of equally sized suppliers. Neither number is a percentage of the choice a traveller has. [S16]
1. Framework: three questions hiding inside one growth number
An airline opens a route and the announcement carries one figure: seats, flights, or a percentage. This index splits that figure into supply, control and continuity, and reports each one without folding them into a single headline number.
The three do not move together. The six routes below are ordered so that each isolates one of them. Two are cases where combining documented corporate entities reverses the measured trend; one needs no grouping assumption at all; two involve arrangements a regulator authorised in writing; the last is about whether an alternative survived the calendar. [S01] [S02] [S18]
Sections 9 to 11 then leave the cases behind and ask how often each of these patterns holds across every sustained market in four countries.
Everything here is retrospective. The observation years are 2024 and 2025, and the research snapshot was assembled between 20 and 22 September 2026 from the June 2026 BITRE workbook, an ANAC file retrieved that morning, Taiwan’s 2025 monthly tables and two full years of US T-100. Nothing in it describes schedules on sale today. [S01] [S02] [S12] [S18]
2. Case: New York–London, five airlines and two joint businesses
Six airline labels filed capacity on New York JFK–London Heathrow in 2025, together 3,906,314 seats, though one of them, Saudia, filed only 290. Read through those labels the route scores 72.86, or 3.68 equally sized suppliers. For a single airport pair that is unusually well spread, and it is the number a count of airline names reports. [S18]
Two of those pairs are not separate commercial decisions. British Airways and American run a joint business granted antitrust immunity by the US Department of Transportation in Order 2010-7-8; Virgin Atlantic and Delta under Order 2013-9-14, amended by Order 2019-11-14. Between them those four labels hold 94.88% of the seats. [S17]
Combine each pair where its grant applies and the score falls to 53.52, effective suppliers from 3.68 to 2.15. JetBlue, at 199,552 seats and 5.11%, is the only independent operator of any size. The route also shrank 1.47% across the year, so this is not a growth story. It is what a label count conceals on a mature one. [S17] [S18]
Immunity is authorised coordination, not common ownership, and approval is not proof of implementation. The oneworld grant also carries a remedy: four slot pairs at Heathrow transferred to competitors for ten years. The regulator was acting on the same concern this measure describes, and wrote it into the order. [S17]
| Reporting label | 2025 seats | Share | Joint business |
|---|---|---|---|
| British Airways (BA) | 1,379,331 | 35.31% | oneworld, Order 2010-7-8 |
| Virgin Atlantic (VS) | 1,213,481 | 31.06% | SkyTeam, Order 2013-9-14 |
| American Airlines (AA) | 758,292 | 19.41% | oneworld, Order 2010-7-8 |
| Delta Air Lines (DL) | 355,368 | 9.10% | SkyTeam, Order 2013-9-14 |
| JetBlue Airways (B6) | 199,552 | 5.11% | none |
| Saudia (SV) | 290 | 0.01% | none |
3. Case: São Paulo–Lima, the same seats read two ways
ANAC records 589,894 two-way seats on SBGR-SPJC in 2024 and 694,299 in 2025, a rise of 17.70%. The 2025 file carries four reporting codes where 2024 carried two. Read through those codes, the dispersion score climbs from 35.54 to 48.32, which looks like a market opening up. [S02]
Combine the two entities that LATAM's own filings consolidate inside the group and the same seats produce the opposite reading: 35.54 falls to 32.00. In effective suppliers, 1.55 becomes 1.47. Both 20-F filings tag LATAM Airlines Peru S.A. as a consolidated member, and the 2024 filing tags TAM Linhas Aéreas S.A. the same way. [S02] [S04] [S05]
The group reading is the conservative one, and it is the reason a longer list of airline codes is a poor proxy for independent choice. No merger is inferred here, and no explanation is offered for why LATAM chose to fly part of this route under its Peruvian entity.
| Measure | 2024 | 2025 | Change |
|---|---|---|---|
| Two-way operated seats | 589,894 | 694,299 | +17.70% |
| Dispersion score, reporting codes apart | 35.54 | 48.32 | +12.77 points |
| Dispersion score, LATAM entities combined | 35.54 | 32.00 | -3.54 points |
| Effective suppliers, LATAM entities combined | 1.55 | 1.47 | -0.08 |
| LATAM share of annual seats | 76.91% | 80.08% | +3.17 percentage points |
4. Case: where the extra São Paulo–Lima seats came from
The ANAC file names its carriers, and the names do most of the work. LPE is LATAM Airlines Perú. It reported no capacity on this pair in 2024, appeared in March 2025 with 276 seats, and ran close to 10,000 seats a month from April onward. TAM, LATAM's Brazilian entity, did not give up capacity to make room: it held between 35,842 and 42,120 seats a month all year. [S02]
So this is not a reporting-mix change. It is real additional capacity, supplied by a second entity inside the same group. The count of names rose. The count of independent decision-makers did not. Together the two added 102,334 seats, 98.02% of the route's net increase. [S02] [S04] [S05]
The fourth code is worth a sentence because of how small it is. Aerolíneas Argentinas appears once, in April 2025, with one flight in each direction and 170 seats per flight. Dropping those 340 seats as a test leaves the 2025 grouped score at 31.93, still below 2024. Weighting months by seats instead of equally gives 35.50 falling to 31.89. The reversal does not depend on either choice. [S02]
One asymmetry is worth stating plainly: SKX is Sky Airline Perú, part of the Chilean Sky group, and no group consolidation is applied to it. On this route that changes nothing, because no other Sky entity reports capacity here. Elsewhere it would matter, and the index does not claim to have resolved every ownership chain. [S02]
| Code and carrier name in the ANAC file | 2024 seats | 2025 seats | Change |
|---|---|---|---|
| TAM — TAM Linhas Aéreas S.A. | 453,673 | 463,140 | +9,467 |
| LPE — LATAM Airlines Peru (ex-LAN Peru S.A.) | 0 | 92,867 | +92,867 |
| SKX — Sky Airline Peru S.A.C. | 136,221 | 137,952 | +1,731 |
| ARG — Aerolineas Argentinas S/A | 0 | 340 | +340 |
| Total | 589,894 | 694,299 | +104,405 |
5. Case: Perth–Singapore, no new name and a more even split
Four labels appear in both years once Scoot Tigerair is normalised to Scoot under the naming note in BITRE's September 2025 report, which records the August 2025 label change: Qantas, Jetstar, Singapore Airlines and Scoot. Seats rise from 1,636,607 to 1,729,119. Nothing entered, nothing left. [S01] [S15]
Under the Qantas/Jetstar and Singapore Airlines/Scoot groupings the score still improves, from 25.96 to 30.48, because the smaller of the two groups grew and the larger barely did. Jetstar added 77,952 seats; Qantas shed 9,267. Effective suppliers move from 1.35 to 1.44. [S01] [S06] [S07]
That is a more even capacity split under this grouping. It is not evidence of cheaper tickets, and the two groups remain far apart in size. A route can improve on the control axis without a single new airline name, which is the mirror image of São Paulo–Lima. [S01]
6. Case: Gold Coast–Christchurch, growth that concentrated the route
This route carries no grouping assumption at all. Jetstar and Air New Zealand are the only labels in both years, they are not related, and no scenario is applied. Seats rise 22.65%, from 100,952 to 123,814. [S01]
The dispersion score falls from 46.59 to 37.10, and effective suppliers from 1.87 to 1.59, because Jetstar took 62,472 seats to 87,770 while Air New Zealand went from 38,480 down to 36,044. The months in which both labels held at least 5% of seats slipped from twelve to eleven. [S01]
It is the plainest case in the edition: a growing route that became more concentrated, visible without combining anything. Anyone who suspects the São Paulo result is an artefact of Mubboo's own grouping choices can test the thesis here instead.
7. Case: Brisbane–Doha, coordinated growth is still growth
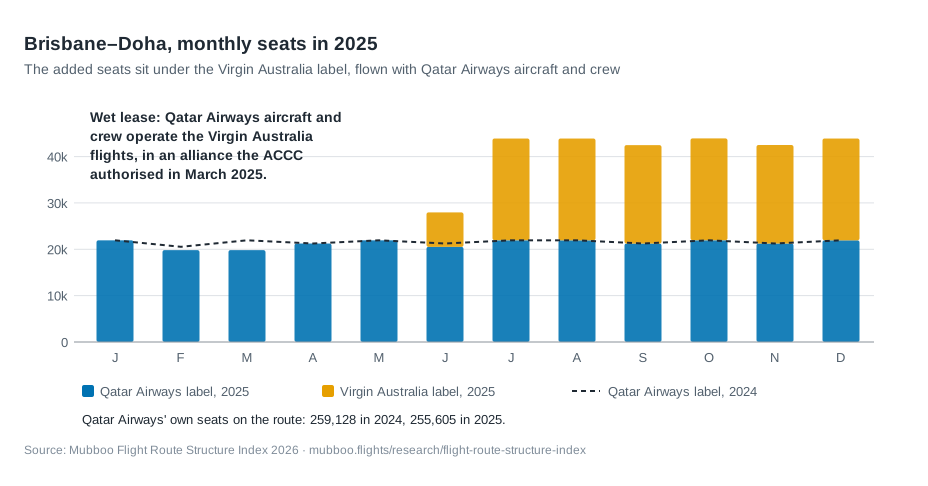
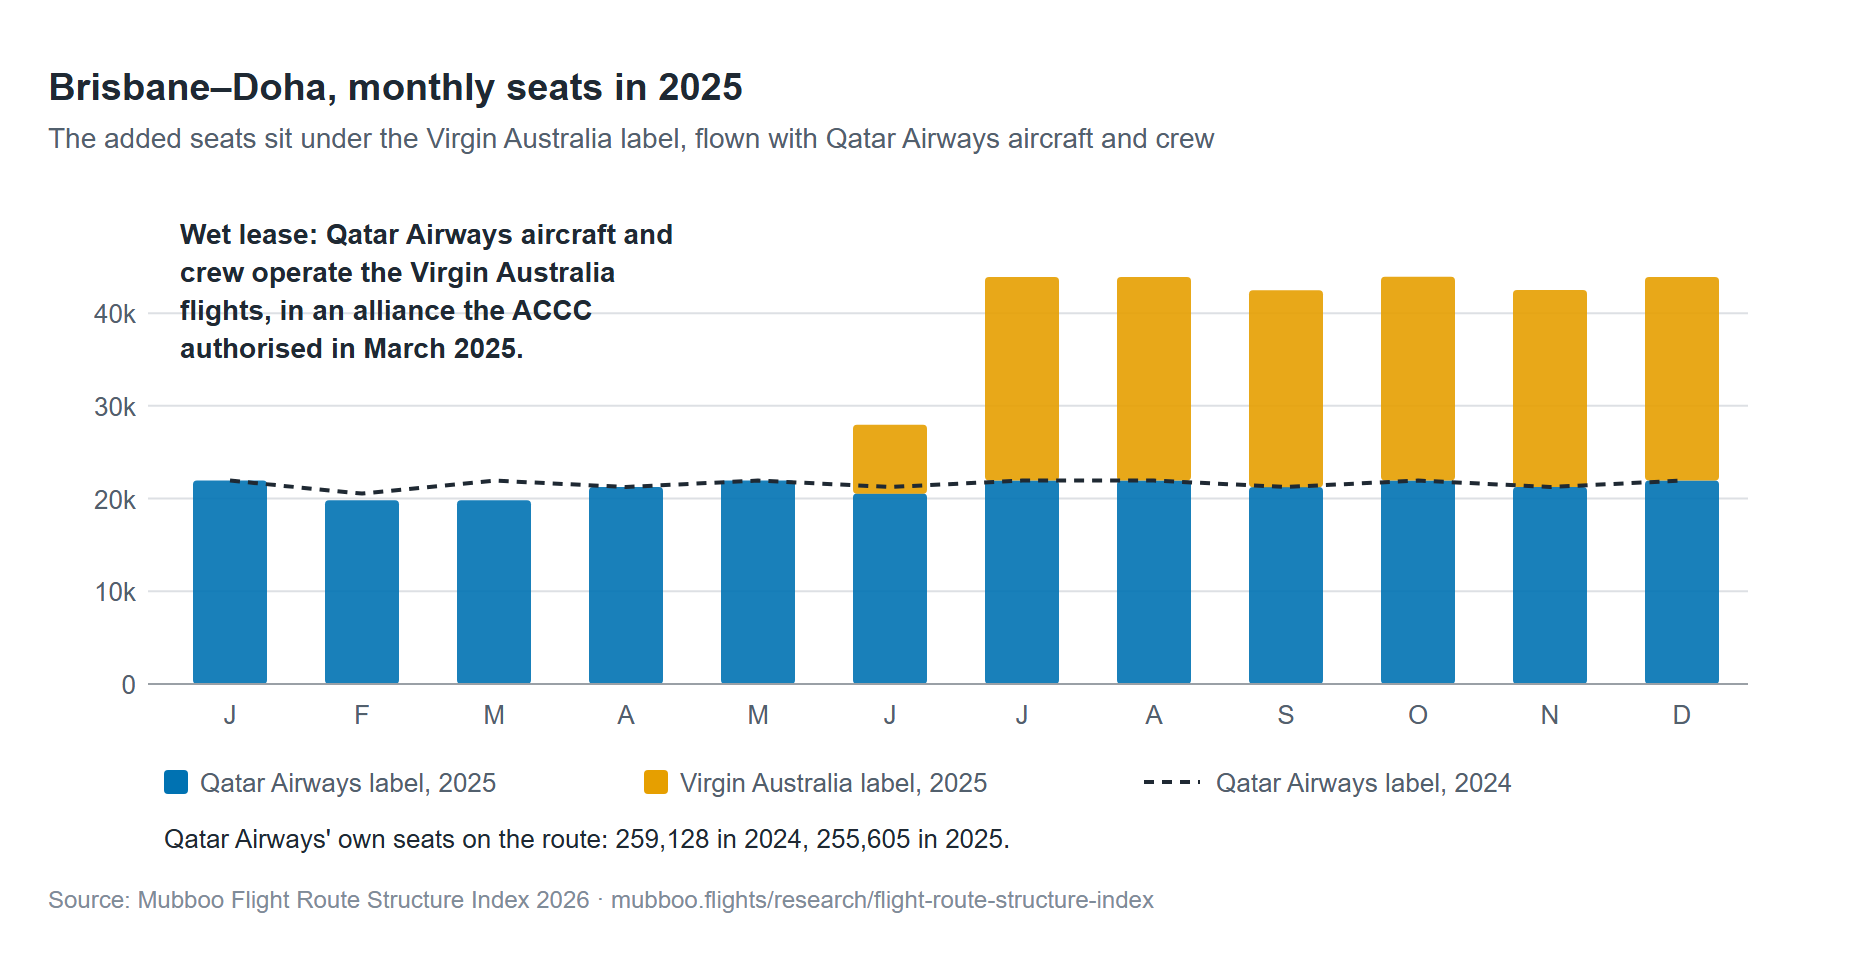
Seats rise 51.80%, from 259,128 to 393,359, and a Virgin Australia label joins Qatar Airways in 2025. On reporting labels the score moves from zero to 28.25. On the face of it, a monopoly route gained a competitor. [S01]
The records say something more specific. Qatar Airways' own capacity fell by 3,523 seats, or 1.36%. Every seat of the 134,231 net increase, and then some, sits under the Virgin label. [S01]
That label arrived by agreement. The ACCC authorised an integrated Virgin-Qatar alliance on 28 March 2025, stating that Virgin "will use Qatar Airways' aircraft and crew to operate the new services under a 'wet lease' arrangement". The IASC determination records the same wet lease at §1.2. Virgin announced a 19 June Brisbane start. [S09] [S10] [S11]
The IASC determination that allocated the capacity is more specific still. At §3.14 it records that the two carriers "propose to co-ordinate pricing and marketing of the services covered by the arrangements", and at §3.17 it notes the ACCC draft covering cooperation on "the deployment of capacity between Australia and Doha". [S10]
From July the two labels report almost the same seats every month: 21,948 against 21,948 in July, 21,240 against 21,240 in September. Combining them where the documented arrangement applies leaves the score at zero, and effective suppliers at 1.00. This is a route-specific scenario, not a claim of common ownership and not a rule to merge these airlines anywhere else. [S01] [S09] [S10]
A flat score is not a verdict, and the regulator's own expectation ran the other way. The ACCC said the conduct was likely to produce public benefits including additional capacity, and that it would "likely place downward price pressure on these routes". This study cannot test that. It can say that the second name did not bring a second independent source of capacity. [S09]
The IASC did not count the new label as a new competitor either. At §3.32 it found the joint services "unlikely to significantly lessen competition, despite the co-ordination of pricing between them, given that the two carriers do not currently operate in competition with each other". [S10]
Nor was the alternative a rival. At §3.33 the IASC notes the ACCC's view that Virgin was unlikely to start Middle East services within five years without the alliance, and Virgin's own statement that it could not viably start the Doha services otherwise. The choice on this route was coordinated seats or none. [S10]
8. Case: Brisbane–Manila, the annual list that hid the year
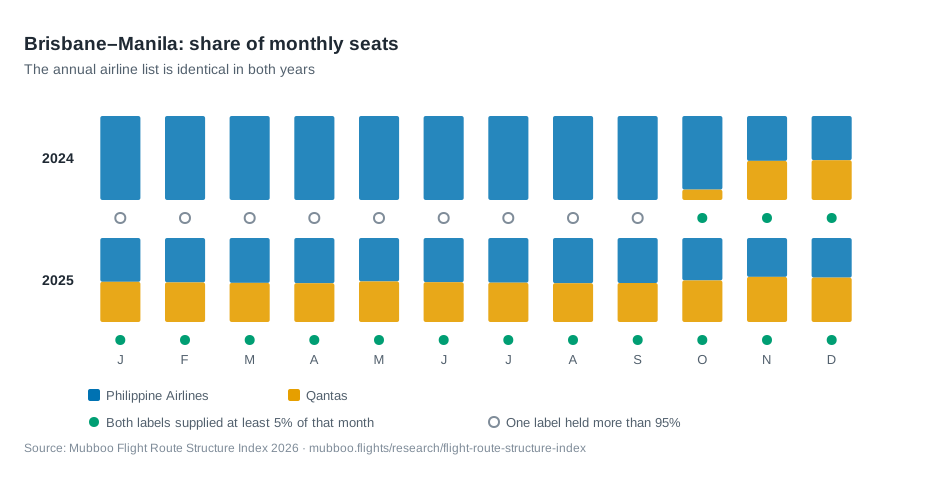
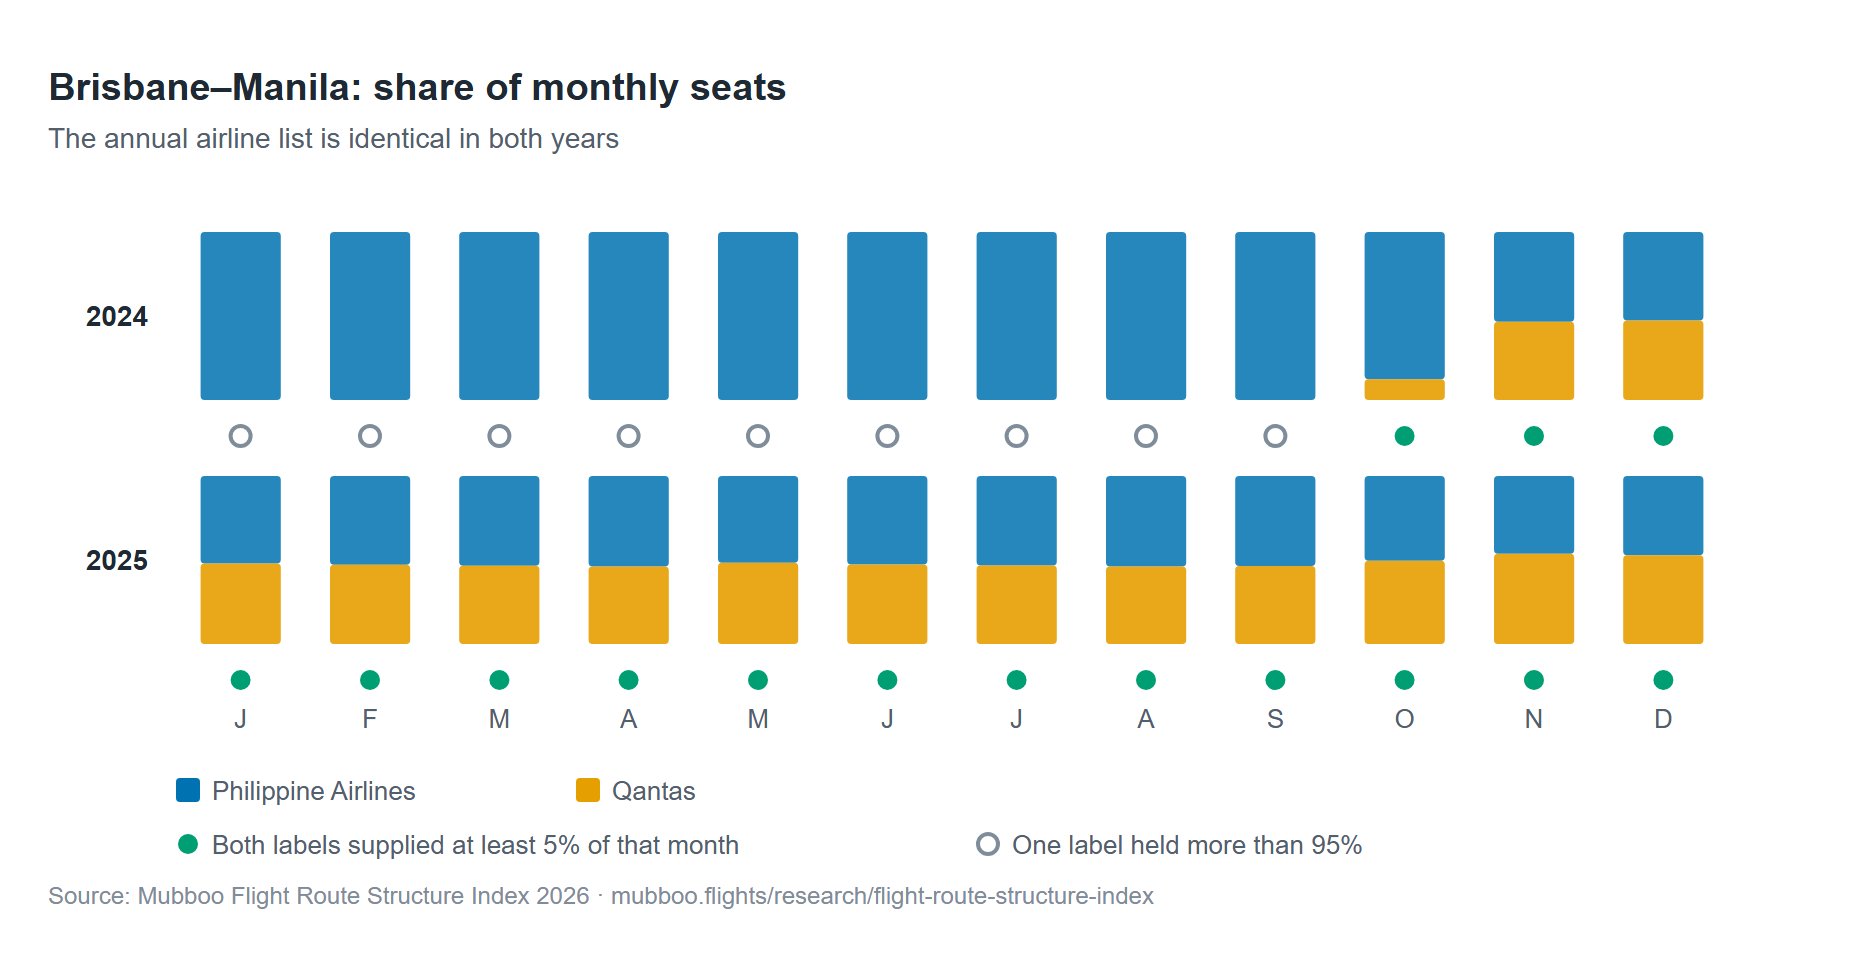
Philippine Airlines and Qantas appear in both 2024 and 2025. An annual airline list would show no change whatsoever. Underneath, the route is close to unrecognisable: seats grow from 125,200 to 235,531 and the dispersion score goes from 10.11 to 49.82, with effective suppliers rising from 1.11 to 1.99. [S01]
BITRE's October 2024 report records Qantas starting Brisbane–Manila that month, and the monthly figures show it: 1,325 seats in October, 8,798 in November, 9,363 in December. Three months of the year had two labels each above 5% of seats. In 2025 all twelve did. [S01] [S08]
Continuity is the axis nobody announces. Launches get a press release; the second year, when a service either settles into the schedule or quietly thins out, does not. On equal month weighting the 2024 score is 10.11; weighting months by seats gives 17.24, because the three months that had two operators were the busiest ones. Both readings leave 2025 near 49.82. [S01]
Monthly co-presence remains a coarse measure. It does not show that two aircraft flew on the same day, at usable hours, or with seats on sale for any particular trip.
9. Pattern: how often growth brought a new airline
Cases explain mechanisms; they cannot establish how common something is. So the index also takes every market with positive seats in all twelve months of both years and at least 100,000 seats in each year: 759 US-linked airport pairs, 107 Australia-linked city pairs and 71 Brazil-linked airport pairs, in separate panels. Of those, 234, 51 and 27 grew by at least 5%. [S01] [S02] [S18]
Those route counts are small; the traffic behind them is not. The US pairs carry 84.6% of the seats in their panel in 2025, the Australian pairs 91.2% and the Brazilian 84.4%. Within each country this is close to a census of sustained international capacity rather than a sample of it. Across countries it is four, which is the real limit. [S01] [S02] [S18]
Entry is more common on growing routes, and no panel can establish it. A new label appeared in 83 of the 234 growing US markets against 166 of the 525 that did not grow, in 9 of 51 against 6 of 56 in Australia, and in 12 of 27 against 12 of 44 in Brazil. Two-sided Fisher exact tests on the two smaller panels give p = 0.41 and p = 0.20. The direction is unsurprising. [S01] [S02] [S18]
What the growth cases have in common is nonetheless the absence of a new name. In 151 of the 234 growing US markets, 42 of the 51 growing Australian ones and 15 of the 27 Brazilian ones, not one new airline label appeared. The extra seats came from carriers already flying the route. [S01] [S02] [S18]
The new-label counts also overstate entry. Three of Australia’s nine are the same Virgin Australia label arriving on Brisbane, Perth and Sydney–Doha: one authorised alliance, counted three times. In four of Brazil’s twelve, every new label is a LATAM group entity, and on three of those routes another LATAM entity was already present. [S01] [S02] [S04] [S05] [S09]
Across the US panel the same mechanism runs at a different scale. 447 US-linked routes carrying 88,017,533 seats in 2025 fall inside a transatlantic joint business holding DOT antitrust immunity. On those routes a count of airline names and a count of commercial decisions are different numbers, and the index publishes both. [S17] [S18]
The dispersion scores mostly sat still. Using reporting labels and a one-point band, 93 of the 234 growing US markets rose, 25 fell and 116 stayed inside the band. Australia: 21, 4 and 26. Brazil: 9, 2 and 16. [S01] [S02] [S18]
That band is an editorial display choice and it flatters the result. Remove it and the falls are 44 in the US, and 9 and 3 in Australia and Brazil, rather than 25, 4 and 2. The counts are published both ways for that reason. [S01] [S02] [S18]
None of this shows that growth failed to improve competition. These counts use reporting labels with no corporate-control adjustment, they exclude wholly new routes and any route without twelve positive months in both years, and they cover four markets rather than the world.
| Source panel | Eligible | Growing | No new label | Rose >1pt | Fell >1pt | Within 1pt |
|---|---|---|---|---|---|---|
| US-linked airport pairs | 759 | 234 | 151 | 93 | 25 | 116 |
| Australia-linked city pairs | 107 | 51 | 42 | 21 | 4 | 26 |
| Brazil-linked airport pairs | 71 | 27 | 15 | 9 | 2 | 16 |
10. Market level: the average route in each panel
Table 4 counts routes. Table 5 weighs them. It takes the same 759, 107 and 71 routes and averages effective suppliers by seats, so a route with a million seats counts ten times as much as one with 100,000. The result is the average route as the panel's travellers met it, read two ways: by reporting label, and with documented ownership groups combined. [S01] [S02] [S18]
In every panel most added seats came from airlines already flying the route: 84.3% in the US panel, 83.1% in Australia and 94.0% in Brazil (Figure 6). Labels new to the route supplied the rest, 15.7%, 16.9% and 6.0%. That count is generous: a new label from an existing group, such as LATAM Airlines Peru at Guarulhos–Lima, is counted as new. [S01] [S02] [S18]
The average US route stayed at 1.87 effective suppliers. Australia's fell, from 2.26 to 2.19. Brazil's rose, from 1.94 to 2.11, and still rose with LATAM's entities counted as one group, from 1.83 to 1.96. On this measure Brazil is the panel where growth did spread capacity across more airlines. [S01] [S02] [S04] [S05] [S18]
Combining owners moves Australia most. With Qantas and Jetstar as one group, and Singapore Airlines and Scoot as another, the average Australian route had 1.93 effective suppliers in 2024, not 2.26. Merging wholly-owned US regional airlines into their parents moves the US average by less than 0.01. Joint businesses are not ownership and are not combined in this table. [S06] [S07] [S19] [S20]
Read each row against its own 2024 value. The US and Brazilian rows count airport pairs and the Australian row counts city pairs, which fold several airports into one market and can on their own raise the count. The panels also cover different parts of the world. No row is ranked against another.
| Source panel | Routes | Added seats from new labels | Effective suppliers, labels | Effective suppliers, owner groups | Seats, 2024 to 2025 |
|---|---|---|---|---|---|
| US-linked airport pairs | 759 | 15.7% | 1.87 to 1.87 | 1.87 to 1.86 | 267.9m to 269.2m (+0.5%) |
| Australia-linked city pairs | 107 | 16.9% | 2.26 to 2.19 | 1.93 to 1.90 | 48.3m to 50.9m (+5.4%) |
| Brazil-linked airport pairs | 71 | 6.0% | 1.94 to 2.11 | 1.83 to 1.96 | 26.1m to 29.2m (+11.6%) |
11. Pattern: did a second option last the whole year?
Continuity gets its own test, on 2025 alone, across all four panels. A market qualifies if it has twelve positive-capacity months, at least 100,000 annual seats, and at least two labels each holding 5% or more of annual seats. The question is then whether two labels also clear 5% in every single month. [S01] [S02] [S12] [S18]
The denominators differ from sections 9 and 10 on purpose. They need a route to be present across two years; this test needs only 2025, plus the annual two-label screen. So Australia contributes 73 markets here rather than 107, and the two sets are not interchangeable.
170 of 427 US markets, sixteen of 73 Australian, five of 33 Brazilian and eight of 77 Taiwanese units fail the all-month test. Raise the floor to 250,000 seats and the US is 80 of 312, while the others fall to five of 53, zero of 23 and three of 57. [S01] [S02] [S12] [S18]
The US gap is the largest by a wide margin and the least surprising. A market with heavy seasonal leisure flying to the Caribbean, Mexico and summer Europe will show more routes where a second airline exists across the year and not in February. That is a description of the network, not a judgment about it.
Failing this screen does not mean a route had one airline, or no service. It means the stated two-label threshold was not met in every month, which entry, exit, seasonality or a source's own classification can all produce.
| Source panel | 100,000-seat floor | 250,000-seat floor |
|---|---|---|
| US-linked airport pairs | 170 / 427 | 80 / 312 |
| Australia-linked city pairs | 16 / 73 | 5 / 53 |
| Brazil-linked airport pairs | 5 / 33 | 0 / 23 |
| Taiwan airport/destination-label units | 8 / 77 | 3 / 57 |
12. Discussion: what would explain this, and what would settle it
Three results in this edition have obvious candidate explanations that capacity records cannot choose between. Naming them is more useful than leaving a reader to guess, so each is paired here with the evidence that would actually settle it.
Why LATAM added São Paulo–Lima capacity through its Peruvian entity rather than its Brazilian one: route authority under the relevant bilateral, aircraft and crew basing, or commercial positioning of the Peru operation would each produce exactly this pattern. Dated route-authority filings or the group's own fleet assignment would separate them. A seat file cannot. [S02] [S04] [S05]
Whether Qatar Airways' 1.36% capacity decline on Brisbane–Doha means anything: on one route over one year, 3,523 seats is small enough that aircraft substitution or ordinary schedule variation could produce it on its own. It is reported because its direction contradicts the headline, not because its size is decisive. Several years of the same series would settle it. [S01]
Why incumbents supply most of the growth: slots and traffic rights are allocated rather than open, adding frequency to a route an airline already flies is cheaper than opening one, and entry is lumpy by nature. Slot allocations and fleet data would test that. They are not in any of the three capacity sources used here, and this study does not claim to have tested it.
13. Method: how the index is built
Australia uses BITRE's own city-pair labels, Brazil uses ANAC airport pairs, Taiwan uses each local airport combined with the official foreign-destination label. Those units are not interchangeable and their counts are never added together. Taiwan is a 2025 supplement only, and its tables include charters administered as scheduled services, so no Taiwanese year-on-year result is claimed. [S01] [S02] [S12] [S13]
Show the full sectionHide
The United States uses BTS T-100 International Segment, filtered to scheduled passenger service with positive seats and performed departures, exactly one US endpoint, combined into direction-neutral airport pairs. [S18]
Its identity layers follow the same rule as everywhere else. Wholly-owned regional subsidiaries go into the corporate-group lens on their parent’s filings: American names Envoy, PSA and Piedmont, Delta names Endeavor and describes itself controlling their scheduling, pricing and seat inventory. [S19] [S20]
Third-party regional operators are flagged and never merged, because T-100 records who flew a segment and not who sold it. Alaska’s Horizon Air is left unmapped as well: no current filing was opened for it, and at a tenth of a percent of the panel a weaker-evidenced scenario is worse than none. [S18]
From BITRE the extraction keeps 2024 and 2025 rows with Stops=0, positive seats and positive flights, in both directions, from the Data worksheet whose header sits on row 12. From ANAC it keeps REGULAR services with exactly one Brazilian endpoint and positive departures and seats, combined into unordered ICAO pairs. [S01] [S02] [S03]
The ANAC file is 358,893,852 bytes and changes as the agency updates it, so this edition freezes the version retrieved on 20 September 2026 and reads it in byte ranges with a checked 256-byte overlap rather than assuming a later download would match. [S02]
One alias is normalised, Scoot Tigerair to Scoot, on BITRE's own note. Nothing else is merged on a brand substring. Operated capacity is not tickets sold and not inventory available for local sale, and codeshare listings are not counted as extra flights. [S01] [S15]
Annual growth is the plain year-on-year change. Because 2024 had 366 days, a daily check runs alongside it, comparing average seats per day: São Paulo–Lima's 17.70% becomes 18.02% on that basis. At the 100,000-seat floor the choice changes Brazil's growing-market count from 27 to 29, and leaves Australia's at 51. The tables use annual totals. [S01] [S02]
Equal month weighting is an editorial choice, made so that a service running two months does not read the same as one running twelve. Seat-weighted scores are published beside it, in this report and for every route in the dataset. A month with no recorded capacity is never scored as a monopoly; the route simply gets no full-year score.
Presence thresholds of 1%, 5% and 10% are all tested, and no threshold ever removes a small carrier from the concentration calculation itself: a screen decides what counts as a second option, not what counts as capacity. [S16]
14. Method: what the checks confirmed, and what they did not
A second, independent calculation using exact fractions rechecked 516 full-year market-year records covering 6,192 monthly positions, plus 232 two-year seat-change decompositions, twelve case-year scenarios and eighteen cohort and band combinations. The separate three-panel 2025 work adds 7,596 monthly positions, 27 cohort and threshold combinations and 15 group scenarios. The two sets overlap and are not summed.
Show the full sectionHide
Taiwan's twelve monthly tables sum to the annual control of 72,664,367 seats. Two destination-label cells still differ by offsetting amounts of 720 seats, and that discrepancy is left in rather than quietly corrected: a national total reconciling does not validate every route label. [S12] [S13]
Three Australia-Taipei pairs produce different annual totals in BITRE and in CAA. Sydney-Taipei differs by 440 seats, Melbourne-Taipei by 582, Brisbane-Taipei by 638. Neither source is averaged into the other and the cause is unresolved. It is one more reason the three panels are never merged into a single ranking. [S01] [S12]
The US files are frozen by hash like the others: the 2024 download is 1,899,993 bytes and the 2025 download 1,967,253 bytes, both listed in the register. Every month of both years is present, and the extraction rejects a file whose year or month coverage does not match what was requested. [S18]
These are arithmetic checks on retained records. They are not external peer review, and they cannot establish corporate control in every month, local traffic rights, freedom to sell seats, or source-reuse permissions.
Six deep cases were calculated on the Australian and Brazilian panels; five are shown here and the sixth, Darwin–Singapore, is in the dataset. The US case was selected from the panel on capacity, not on its score.
| Source / year | Included records | Seats |
|---|---|---|
| T-100 / 2024 | 80,002 | 312,557,621 |
| T-100 / 2025 | 84,292 | 318,139,762 |
| BITRE / 2024 | 6,569 | 51,882,392 |
| BITRE / 2025 | 6,970 | 55,746,649 |
| ANAC / 2024 | 4,242 | 29,498,273 |
| ANAC / 2025 | 5,301 | 34,555,092 |
| CAA / 2025 | 4,281 | 72,664,367 |
15. Limits: what this index cannot tell you
It does not measure fares, and no result here should be read as evidence about prices, consumer welfare or harm. It does not rank countries or routes globally: two source panels and one supplementary panel, with different units, are not a world sample.
It does not establish who competes with whom. Reporting labels are not audited economic entities; the corporate and cooperation scenarios are specified, dated where the evidence allows, and explicitly incomplete. Unmapped airlines are not certified as independent, and ordinary alliance membership is never treated as common control.
It carries one uncertainty the other panels do not. Third-party regional operators fly US routes under contract to mainline carriers, and T-100 records the operator, not who sold the seat. Those labels are neither merged nor certified independent, and the routes they touch are flagged rather than quietly counted as extra suppliers. [S18] [S19]
It does not describe what a traveller can buy. Operated capacity is not inventory on sale, and a nonstop route is not the whole market for a journey that can be flown with a connection. No legal competition finding, no fare effect and no external peer review is claimed.
16. Conclusion: what a growth announcement should disclose
Three numbers instead of one. How many seats arrived. Which entities or documented groups supplied them. Whether a second meaningful option was present across the year rather than in the annual summary alone. One favourable figure cannot answer all three, and on these routes the three regularly disagreed.
For anyone reading an industry claim, the practical question is which of the three a given announcement is actually describing. More supply, a different balance among existing suppliers, and a genuinely additional operator are three different events, and only one of them is usually what the headline implies.
New York–London shows five airlines resolving into three decisions. São Paulo–Lima shows identity reversing a measured trend. Perth–Singapore shows that a new name is not required for a more even split. Gold Coast–Christchurch shows growth and concentration rising together with nothing assumed. Brisbane–Doha shows why a flat score is not a verdict. Brisbane–Manila shows the year hiding inside the annual list.
| Route | Reporting labels, 2024 to 2025 | Group or cooperation scenario |
|---|---|---|
| New York JFK–London Heathrow | 3.72 to 3.68 | 2.16 to 2.15 |
| São Paulo Guarulhos–Lima | 1.55 to 1.93 | 1.55 to 1.47 |
| Perth–Singapore | 2.40 to 2.61 | 1.35 to 1.44 |
| Gold Coast–Christchurch | 1.87 to 1.59 | none applied |
| Brisbane–Manila | 1.11 to 1.99 | none applied |
| Brisbane–Doha | 1.00 to 1.39 | 1.00 to 1.00 |
17. Data: how to cite this edition and get the numbers
Every route the calculation produced is published, not only the cases discussed here: 3,656 rows across the US, Australian and Brazilian panels, with seats, dispersion scores, seat-weighted scores, annual-share scores, effective suppliers, monthly two-label counts, label changes and the cohort flags behind Table 4.
The file is https://mubboo.flights/research/flight-route-structure-index/data/mubboo-flight-route-structure-index-2026-routes.csv. Its field dictionary and licence are at https://mubboo.flights/research/flight-route-structure-index/data/README.md. The data and charts are published under CC BY 4.0: reuse is free, including commercially, with credit to Mubboo Flights Research.
Two columns are US-only and are there because the panel has an uncertainty the others do not: seats flown by third-party regional operators, and whether an immunised joint business covers the route. The published scores apply neither; both scenarios are reported separately so a reader can rebuild either one. [S17] [S18] [S19]
How to cite: Mubboo Flights Research (2026). Mubboo Flight Route Structure Index 2026: The Gap Between Airline Counts and Independent Choice. Data snapshot 20 September 2026. https://mubboo.flights/research/flight-route-structure-index. When you quote a route, quote its panel and unit type with it: a BITRE city pair and an ANAC airport pair are different objects.
Only Mubboo's derived values are published; no source agency file is redistributed. Each source artifact is listed in the register with its size and hash, so anyone can obtain it from the agency and rebuild these numbers.
The terms allow it. BTS material is public domain under 17 U.S.C. §105, Brazil's Decreto 8.777/2016 art. 4 makes federal data free to use with the source credited, and Taiwan's Open Government Data License permits derivative works with attribution. [S01] [S02] [S12] [S18]
Corrections are welcome and are dated on this page rather than applied silently. Methodology questions and correction requests reach a named person, not a form; the contact is published with the report. Each edition stays published at its own address; a later edition adds to the record rather than replacing what an earlier one said.
Explore the data
Search, filter and chart the rows behind this report. It runs in your browser on the published CSV; nothing is sent anywhere.
One row is one route. The three panels count different things (airport pairs or city pairs) and are never pooled, so choose one. Effective suppliers is 1 divided by the mean monthly concentration, not a count of airlines. A blank means the route had no comparison across both years. Search US and Brazil routes by airport code (JFK, SBGR) or airline label; Australian routes by city name. Capacity only: no fares.
Loading the data…
FAQ
Is this a global ranking of the most competitive flight routes?
No. It covers US-, Australia- and Brazil-linked route changes in 2024 and 2025, with a separate Taiwan panel for 2025 only. The units and service definitions differ between panels, the panels are never combined, and no country is ranked against another.
Does a lower dispersion score mean higher airfares?
Not in this study. Fares are not measured and no causal relationship is estimated. A lower score means reported seats are more concentrated under the stated label, group or cooperation rules. It is not a finding about prices or consumer harm.
Are airlines in the same alliance always combined?
No. Alliance membership, codeshares, interlining and minority stakes do not establish common control. Documented parent relationships and route-specific commercial cooperation are tested as separate, labelled scenarios, and airlines left unmapped are not certified as independent.
Why does a score of 50 not mean half the available choice?
Because the score transforms concentration rather than counting travel options. Two evenly matched suppliers in every month produce 50 by construction. The number says nothing on its own about connecting itineraries, prices, departure times or how much choice a traveller actually has.
Can we reuse the charts and the data?
Yes, with attribution to the Mubboo Flight Route Structure Index and the data snapshot date. The figures and the route-level dataset are Mubboo's own derived work. The underlying agency files are not ours to redistribute, and the appendix lists them so you can obtain them from the source.
Sources
- S01 — BITRE, international scheduled passenger operated flights and seats, June 2026 workbook; Data, Notes and Missing worksheets; 2024-2025 rows (checked 2026-09-20)
- S02 — ANAC, Dados Estatisticos.csv; official operated-capacity records including reporting carrier names; 2024-2025 extraction retrieved 20 September 2026 (checked 2026-09-20)
- S03 — ANAC, dataset metadata and reporting definitions for Dados Estatisticos do Transporte Aereo (checked 2026-09-20)
- S04 — LATAM Airlines Group, 2024 Form 20-F; tags LATAM Airlines Peru S.A. and TAM Linhas Aereas S.A. as consolidated members for the 2024 period; not a full filing audit (checked 2026-09-20)
- S05 — LATAM Airlines Group, 2025 Form 20-F; tags LATAM Airlines Peru S.A. as a consolidated member for the 2025 period; not a full filing audit (checked 2026-09-20)
- S06 — Qantas, Subsidiary companies; Jetstar Airways Australia/New Zealand relationship (checked 2026-09-20)
- S07 — Singapore Airlines, Our subsidiaries; Scoot ownership (checked 2026-09-20)
- S08 — BITRE, International airline activity, October 2024; printed page 28, Notes on airline services (checked 2026-09-20)
- S09 — ACCC, Virgin Australia and Qatar Airways integrated alliance authorised, 28 March 2025; states the wet-lease arrangement and the expected public benefits, including downward price pressure (checked 2026-09-20)
- S10 — IASC determination [2025] IASC 102, 4 March 2025; sections 1.2, 3.14, 3.17, 3.32 and 3.33; wet lease, route-specific coordination and the no-alliance alternative (checked 2026-09-26)
- S11 — Virgin Australia, Takes Off to Doha, 12 June 2025; announced Brisbane service timing, not independently measured economic benefits (checked 2026-09-20)
- S12 — Taiwan CAA, monthly statistics; 2025 and local year 114, individual-month table 36 in twelve ODS files (checked 2026-09-20)
- S13 — Taiwan CAA, 2025 annual ODS; table 53 used as the annual seat control (checked 2026-09-20)
- S14 — OAG, Middle East Aviation: Balancing Growth and Competition; industry use of route HHI, no OAG figures imported (checked 2026-09-20)
- S15 — BITRE, International airline activity, September 2025; note on the Scoot Tigerair to Scoot reporting-label update (checked 2026-09-20)
- S16 — US Department of Justice, Antitrust Division, Herfindahl-Hirschman Index; definition and 0-10,000 scale, cited for the measure, not for any threshold (checked 2026-09-20)
- S17 — US Department of Transportation, Aviation Antitrust Immunity Cases; the active-alliance registry with dockets, order numbers and conditions; last updated 18 November 2025 (checked 2026-09-22)
- S18 — US DOT Bureau of Transportation Statistics, T-100 International Segment (All Carriers); available seats, performed departures and carrier by month; 2024 and 2025 extractions (checked 2026-09-22)
- S19 — American Airlines Group, FY2025 Form 10-K; distinguishes the wholly-owned regional carriers from third-party regional carriers (checked 2026-09-22)
- S20 — Delta Air Lines, FY2025 Form 10-K; identifies Endeavor Air as a wholly owned subsidiary and describes Delta controlling scheduling, pricing and seat inventory on Delta Connection flights (checked 2026-09-22)
The Mubboo Flight Route Structure Index covers airline-level route capacity in the markets where regulators publish it. That population is the index’s definition, not a shortfall against some wider ambition: most authorities publish passenger counts, or publish carriers and routes in tables that cannot be joined. Each edition names the markets it covers.
BTS material is a work of the United States Government, in the public domain under 17 U.S.C. §105 and reusable with source citation. The Australian, Brazilian and Taiwanese source files carry their own terms and are not redistributed here. [S18]
All route totals, scores, cohort counts, figures and the published dataset are Mubboo calculations from the cited records unless identified as a source statement. BITRE, ANAC, Taiwan's CAA and the regulators cited here neither produce nor endorse these scores. Data snapshot 20 September 2026; observation years 2024 and 2025, with Taiwan 2025 only.
Corporate and cooperation results are specified scenarios, not a complete independence audit. HHI is a long-established concentration measure, used here descriptively: no merger-enforcement threshold is applied to any route. [S14] [S16]
Mubboo compares flight options and may earn a commission when a traveller uses a partner link. We do not sell tickets or control provider inventory, and affiliate status is not a variable in any calculation in this edition.
Mubboo Flights Research Team · Reviewed by Richard Lee, Research lead, 22 September 2026